So the big event has come and gone. Powell spoke and markets popped.
But then they dropped.
As I write this, it looks like they’re bouncing again, just a hair above today’s open.
Powell basically said what markets wanted to hear: “The time has come for policy to adjust.”
In plain English: they’re ready to reduce rates.
Which might make the market happy in the short term, but as I showed you earlier this week, rate cuts aren’t bullish for the market.
The Fed doesn’t cut rates when things are going well. They cut them when data shows the economy is slowing down.
And because it takes 18-24 months for rate changes to make their way through the massive machine that is the U.S. economy, it’s usually a case of “too little, too late.”
And markets usually end up taking a dip anyway.
Now, one thing I wanted to mention, because I’ve been talking about it a lot lately is using Fibonacci levels, or Fibs for short.
There are a million different ways to use Fibs, but I want to give you one simple way you can use them.
Whenever you see a big drop in the market, that’s one time I’ll use the Fibs.
As an example, let’s use the roughly 10% drop we saw in the S&P between mid-July and August 5th.
Most trading platforms will allow you to draw Fibonacci levels on a chart.
What you what to do is go to a daily chart, where each candle represents a day, and plot your first point at the top of the tallest candle.
Then draw your second point at the bottom of the lowest candle.
I recently did that for the S&P Futures (ticker symbol /ES) and here’s what it looks like on my chart:
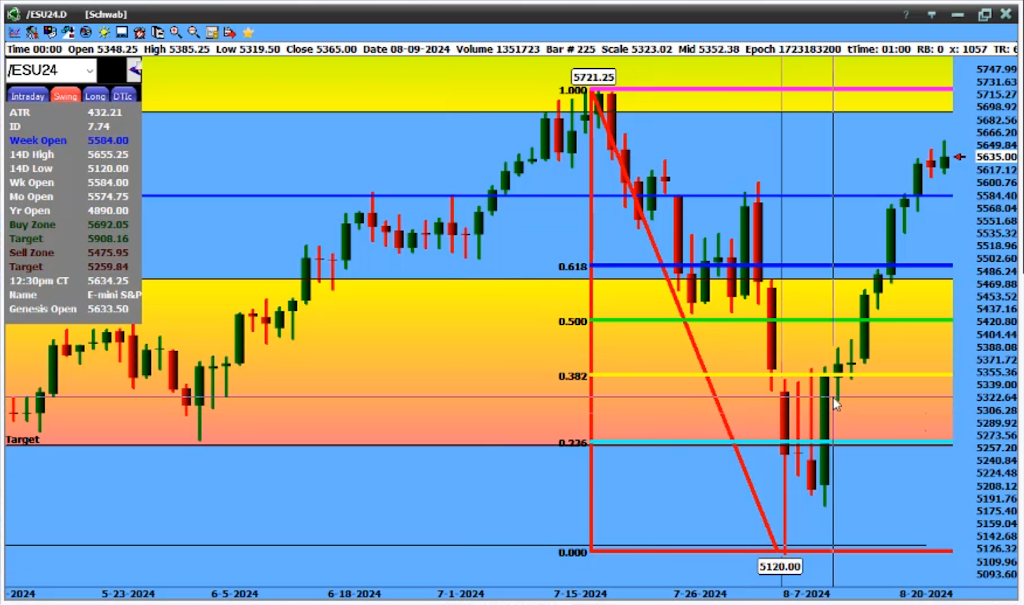
When you do that, you’ll see that the Fib levels automatically get added.
Now, a lot of people use Fibs in different ways, but I like to look at the 0.382.
As you can see on the chart above, the market spent a couple of days hitting that level and then bouncing down.
That tells us that it was a significant point of resistance.
After hitting that level for 4 days, notice what happened.
On the 5th day, the price actually closed above the 0.382 level.
And then, almost like magic, the “ceiling” or resistance that this level had been giving gave way and suddenly became support — a “floor”.
From there, the price moved pretty quick. Within 2 days, it had closed above the 0.500 level, at which point the 0.618 level became a ceiling.
It took a day to test that 0.618 ceiling and a day after that, the ceiling became a floor.
One of the key things to remember is that Fibs don’t guarantee anything.
A close above the 0.382 or the 0.618 doesn’t mean the market “will” continue higher.
It just gives us a roadmap of increasing odds about what the market “could” do.
Since the S&P futures closed above the 0.786 Fib level on Monday, they haven’t made a trip down below that level.
And despite Powell’s speech this morning sending markets up and then down, it hasn’t broken that level to the downside.
The market has found a new “floor” — at least for the time being.
Enjoy your weekend.
— Geof Smith
P.S. With the S&P 500 just over 1% away from a new all-time high… It’s the perfect time to think about my favorite type of hedged trading strategy.