🚨 I’ll be live at 2:30 p.m. ET with Alex Reid🚨
We’ll cover why we’re shorting a major automaker, how to exploit a volatility mispricing via LEAPS, and the cold hard data behind our lower Bitcoin price targets [tap to join us for Profit Panel]
When I was coming up in this business, I learned the hard way.
I wasn’t handed a bunch of charts with moving averages and indicators. I was taught to read price — just price — and see exactly where the money was flowing without needing any pictures to tell me.
That was the school I came from. I was taught the hard way to read a market as opposed to an easier way. Literally.
Let me explain it this way.
Remember those kids’ books, “Cat in the Hat,” and “Frog and Toad”? They had pictures on every page that described the story.
You could look at the pictures and understand what was happening, right?
Now grab a Stephen King novel and count how many pictures are in it. Hardly any — just a sparse few to prime your imagination.
Why? Because King gives you every description you need and your mind creates the picture.
You might put bushes on one side of the house, I might stick a big tree in the front yard because I like shade. Our mental images might be a little different, but we’re both seeing the same setting.
That’s how I learned to read the market — not by looking at pictures, but by seeing the flow in the prices themselves.
Learning Charts Backward
For most traders, charts come first. For me, they came much later.
At some point I had to stop and ask myself, what’s all this chart stuff people are talking about?
So I went back and started digging into moving averages, indicators and all the overlays everyone swears by — the whole sha’bam. I had to learn it backward after already knowing how to read the market without it.
And here’s the thing. When I check something like the S&P 500 (SPY) page on Barchart.com’s Trader’s Cheat Sheet, the levels it spits out match the same levels I can see just by watching price trade every day.
The information is identical. The difference is whether you’re relying on pictures or you’re reading the story directly from the numbers.
These days, if I’m looking at a stock, I’ll chunk it up quickly and focus on the key pieces: the month open, the week open, the current highs and lows, and the current average range.
If I can nail those down, I know on average how much a stock is going to move when it opens. Then the only question I need to answer is: up or down today?
If the move stays inside the average range, I’m targeting 30% to 40%. If it exceeds that range, I can push for 80% to 90%.
Why This Matters to You
Most traders get buried in technical indicators and overlay after overlay thinking more information equals better trades. It doesn’t.
What matters is learning to see the market — understanding what price is telling you about where money is actually moving.
Charts can help, sure. But they’re just another way of showing you what’s already there in the price action.
Once you learn to read prices the way I do, you realize the market isn’t that complicated.
It’s just describing itself to you — no pictures required.
You just have to know how to listen.
👉 Click here to join Profit Panel at 2:30 p.m. ET on weekdays!
Geof Smith
Geof Smith Trading
Follow along and join the conversation for real-time analysis, trade ideas, market insights and more!
- Telegram: https://t.me/+lm8_Nq3Su104NmFh
- YouTube: https://www.youtube.com/@FinancialWars
Important Note: No one from the ProsperityPub team or Geof Smith Trading will ever contact you directly on Telegram.
*This is for informational and educational purposes only. There is inherent risk in trading, so trade at your own risk.
P.S. Why the Price of Silver Could Rise Steeply
The pressure is on Fed Chair nominee Kevin Warsh to drastically lower interest rates.
Historically, this directly impacts silver prices and I doubt this time would be an exception.
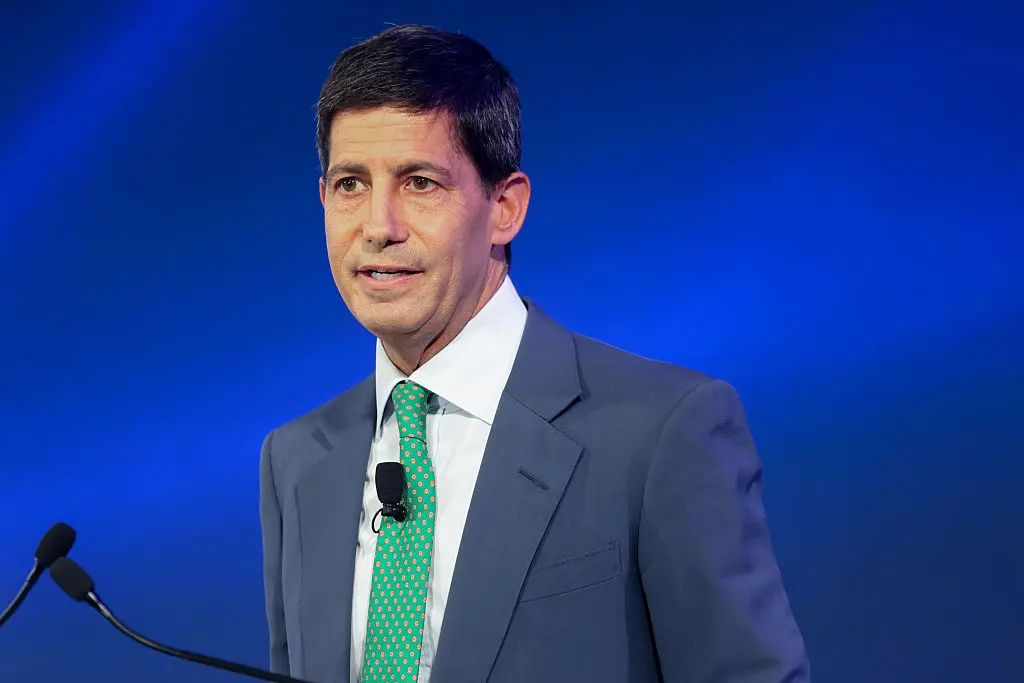
I already have plans in place to play this move while it happens…
Disclaimer: We develop tools and strategies to the best of our ability, but no one can guarantee the future. There is always a risk of loss when trading past performance is not indicative of future results. Since LIVE trading began on 9/18/25, there have been 18 trades, with 15 winners and three still open, continuing the undefeated streak. In LIVE trading, the average return has been 32.05% and the average hold time has been 16 days.