🚨 I’ll be live at with Alex at 9:30 a.m. ET🚨
As the most historically bullish week of the year comes to a close, we are trading live off the open to lock in profits and build our weekend swing list. Join us now to watch Alex take his next intraday setups and see exactly which positions we are letting ride [tap to join us for Profit Panel]
Most traders live by the opening and closing bells.
They know that’s when stocks make their biggest moves — that’s when the action happens. But when you’re trading gold, you’re not waiting around for two narrow windows of opportunity each day.
Gold trades nearly around the clock — from Sunday night at 6 p.m. ET all the way through Friday at 5 p.m. That alone creates a structural advantage most traders never take advantage of.
And there’s another layer to this. When this nearly continuous market began setting up for what I identified as the start of a new gold supercycle back on Dec. 7, 2023, the 24-hour flow became even more important.
Short-term opportunities and long-term structural momentum started aligning in a way you rarely see with equities.
Think about what that means in practical terms. You’ve got traders from Europe, Asia and the United States all active throughout the day.
The market doesn’t sleep. It doesn’t gap wildly on overnight news the way individual stocks can. It just keeps moving, creating fresh opportunities while most equity traders are stuck waiting for the next bell.
Why the 4-Hour Chart Captures What Daily Charts Miss
Here’s where most people get it wrong.
If you’re using a daily chart on gold, you’re leaving money on the table. The system I use monitors a four-hour candlestick chart — some platforms call it a 240-minute chart — because that’s the timeframe that captures the acceleration cycles as they develop.
Gold can enter a quick acceleration cycle at any point during normal U.S. trading hours, and I don’t want to miss a single one. A daily chart would smooth right over those moves. The four-hour view keeps you locked into the global rhythm of the market.
This global participation creates something you don’t often see in individual stocks: consistent liquidity and predictable technical patterns. And because gold trades on price appreciation rather than hopes or hype, the models tend to track it with surprising accuracy.
It’s not just a short-term phenomenon. Gold has outperformed every major index since 2000 — more than tripling the S&P 500 (SPX) and nearly doubling the Nasdaq-100 (NDX; QQQ). The long-term picture supports the same reliability the short-term patterns reveal.
More Opportunities, Less Guesswork
So what does this mean for you?
It means you’re not confined to trading during the first 30 minutes after the open or the last hour before the close. An opportunity can develop on a Sunday evening, a Wednesday afternoon or a Friday morning — and the system is watching for it no matter when it shows up.
That’s the edge. More windows. More liquidity. More chances to get in at the right price without fighting the chaos of a market open or the desperation of a closing auction.
If you’ve been grinding it out with stocks and feeling like you’re always a step behind, maybe it’s time to look at an instrument that doesn’t make you wait for the bell.
Geof Smith
Geof Smith Trading
Follow along and join the conversation for real-time analysis, trade ideas, market insights and more!
- Telegram: https://t.me/+lm8_Nq3Su104NmFh
- YouTube: https://www.youtube.com/@FinancialWars
Important Note: No one from the ProsperityPub team or Geof Smith Trading will ever contact you directly on Telegram.
*This is for informational and educational purposes only. There is inherent risk in trading, so trade at your own risk.
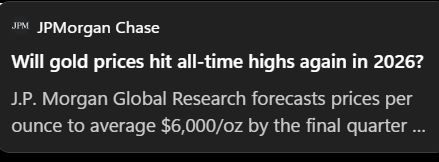
P.S. Urgent Gold Briefing For Traders
Is it time to sell everything or load up on the no. 1 asset in the world?
After trading commodities for more than two decades, I have a better idea!
Disclaimer: The profits and performance shown are not typical; we make no future earnings claims, and you may lose money. The examples shown in this presentation are LIVE trade signals that have been sent since March 13, 2024. Since then, there have been 27 trade alerts, with 21 winners and 6 losers for a win rate of 77.8%. The average return per trade, including winners and losers, is 20.56%, with winners paying out 51.92% on average over a 7.5-day holding period.