🚨 I’ll be live at 2:30 p.m. ET with Ezra🚨
Forget the headlines. We’re tracking the institutional ‘money multiplier’ in a $4 biotech stock and watching the PLTR floor. Also, has Nasdaq gone rogue? The tape doesn’t lie, even when the indexes do [tap to join us for Profit Panel]
Here’s something worth chewing on for a minute.
Global debt now exceeds global GDP. Think about that. That’s never happened before, and we’ve crossed a threshold that changes the game for anyone who understands what drives real value when paper promises start stacking up faster than the economy supporting them.
I’ve been getting questions about the metals lately, especially after the big correction we saw following the huge run over the past year or two. People get nervous when something pulls back after a strong move, and I get it.
But here’s the thing: A big correction after a multi-year run isn’t out of the normal by any means. I was actually wondering when it would happen because the move was stretched, and markets don’t go straight up forever.
Strip Away the Noise and Look at What Matters
When you strip out the noise and go back to the fundamentals, there’s nothing that says gold and silver aren’t going to continue to go higher. That’s what I keep coming back to when I tune out the day-to-day chatter.
The math is simple, and it’s ugly. The debt situation is getting worse, and there’s really only one way out of a hole this deep: Inflation.
We already know what inflation does to purchasing power because we’ve lived through enough of it recently to remember how that feels.
When inflation becomes the path of least resistance for governments drowning in debt, where do you think people turn? They run to inflation hedges like gold and silver.
And it’s not just about what’s happening now. When you look back at moments when the Fed cut rates, whether in 1970 or during the early 2000s after the dot-com bubble, gold didn’t just rise, it exploded higher.
In 1970, it skyrocketed 369%. In the early 2000s, it surged 536%. That kind of historical consistency isn’t an accident because when easy money floods the system, real assets with scarcity win.
The Long View Hasn’t Changed
Another thing worth remembering is that most stocks won’t give you that kind of stability. They’re volatile, especially when markets get shaky.
Gold, on the other hand, has always had that reputation as one of the most stable assets in the world, and there’s a reason people across every country, every economic system, and every generation instinctively trust it.
Look, corrections happen. They’re healthy because they shake out weak hands and reset sentiment.
But the structural case here is rock-solid.
I just don’t see how gold and silver can go down when you’re sitting on a global debt pile that’s bigger than the entire global economy. That’s not a short-term trading setup, it’s a secular shift.
So if the recent pullback had you second-guessing the metals, take a step back. The fundamentals didn’t change, the debt didn’t shrink, and the endgame still points in one direction.
Stay steady and keep your eyes on what matters.
👉 Click here to join Profit Panel at 2:30 p.m. ET on weekdays!
Geof Smith
Geof Smith Trading
Follow along and join the conversation for real-time analysis, trade ideas, market insights and more!
- Telegram: https://t.me/+lm8_Nq3Su104NmFh
- YouTube: https://www.youtube.com/@FinancialWars
Important Note: No one from the ProsperityPub team or Geof Smith Trading will ever contact you directly on Telegram.
*This is for informational and educational purposes only. There is inherent risk in trading, so trade at your own risk.
P.S. 60-0 trading this Gold ‘Glitch’
While most traders react to headlines. I’m focused on a recurring structural “glitch” in gold.
Over the past year, while the market was bouncing from tariffs and hourly swings and now the Iran war…
I leveraged a specific price-action pattern in gold and the results have been amazing…
A perfect record trading just this one setup.
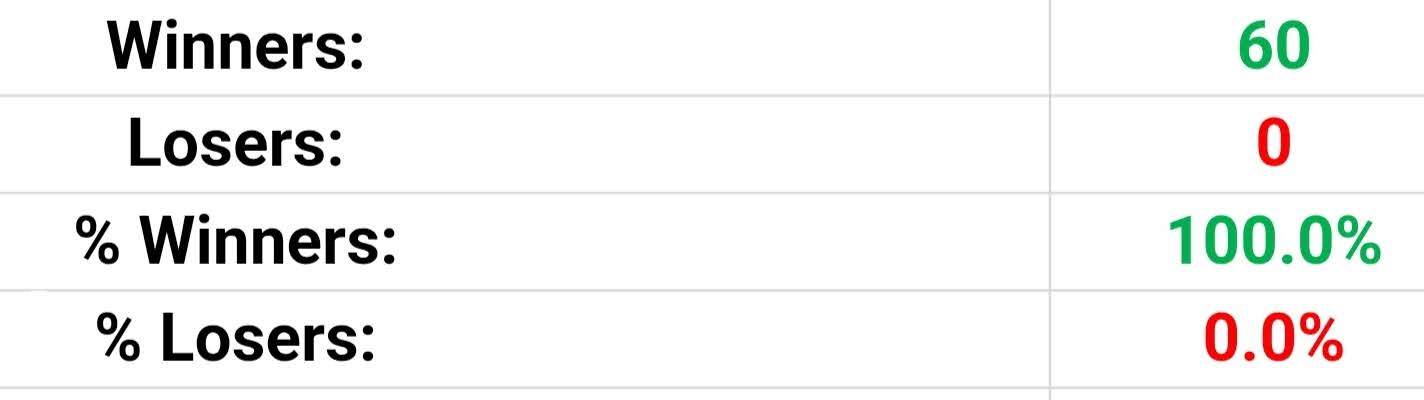
Here’s what makes this pattern so effective…
It doesn’t rely on moonshot moves. Instead, it captures small, overlooked shifts most retail traders miss.
And when paired with the right trade structure…
These small moves have historically unlocked outsized payouts in very tight windows.
We’re up 60-0 using this weekly approach and I can show you how we can go after what could be the 61st winner.
Trading always involves risk, and nothing is guaranteed.
But if you want to see the full data behind this perfect-streak setup before the next trade hits
You Can Access the Briefing Now
Disclaimer: We develop strategies to the best of our ability, but we cannot guarantee a future return. There is always a risk of loss when trading. Past performance is not indicative of future results. Since 12/05/2024, the trading approach discussed today has published 60 trade alerts. All 60 have returned as winning trades, for a 100% win rate. The average return per trade, winners and losers combined, has been 16.88% on an average holding period of 9 days.