JOIN ME LIVE AT 9 AM ET FOR: WATCHLIST WEDNESDAYS
I’ve been watching a technical setup develop that perfectly illustrates one of my favorite concepts in price action — the idea that resistance becomes support. It’s a structure that requires patience and consistency.
Markets move, levels get tested, and the edge comes from trusting the process rather than reacting to every short-term fluctuation.
Recently, I identified a zone that’s become critically important for understanding where the S&P 500 (SPX) is headed in the near term. It’s rooted in recent price behavior around Nvidia (NVDA) earnings — and it’s now acting as a key inflection point.
These setups work when traders stay grounded in what price is doing instead of being pulled around by outside narratives. As I say often, we don’t have to worry about what Trump is gonna say, what the Fed’s gonna do, what news hit this week — price tells the story.
Let me walk you through what I’m seeing and why this level matters so much right now.
The Nvidia Resistance Zone That Flipped
The 6,770-6,780 SPX area represents the previous level of Nvidia resistance — specifically, where NVDA gapped higher on its solid candle and then fell. That’s textbook resistance behavior, and it sets up the potential for a clean support-resistance flip.

We see similar patterns across other instruments when traders use calculated highs or lows as key decision points. I often point to examples like a calculated high that’s serving now as a defense trade. That idea — of a level becoming a battleground where buyers or sellers show up predictably — is the same principle playing out here with SPX.
After we tested lower support levels like 6,810 and 6,800 on Friday’s sell-off, price pushed below those zones and started heading toward this Nvidia-driven level.
What I’m watching now is whether this 6,770-6,775 zone can offer support and push price back up. If it does, it confirms the structure I’ve been tracking. If it fails, we shift to a different roadmap.
Looking at the gamma landscape adds more clarity. The positive-negative gamma pivot level sits around 6,840, with gamma support near 6,780. This confluence reinforces the importance of this zone and supports why traders have responded to it with intention.
What the Response Off This Level Tells Us
So far, the market has shown a solid response off that low. The actual low came in around 6,784, compared to the target of 6,770-6,771 — close enough to validate the structure and keep the support-resistance flip alive.
This zone aligns with the Nvidia top candle, and the emergence of buying interest near this level suggests the market is acknowledging the structure. These are the kinds of details that matter when you’re building trades around technical precision rather than news-driven reactions.
It’s why I emphasize strategy and discipline over headlines.
In the broader context of recent price behavior, we’ve seen similar dynamics play out intraday — quick drops into predefined support zones, methodical bounces to calculated highs, and rotational flows that favor levels over narratives.
I’m not calling this a guaranteed bounce zone. But I am saying this is a spot where previous selling pressure should theoretically provide buying support. It’s a textbook support-resistance flip setup — and when these work, they tend to work cleanly.
If this structure holds, we could see price push back toward the 6,840 pivot and potentially extend beyond. If it breaks, the market likely drifts lower to retest the next support zone, and the roadmap adjusts accordingly.
This is the kind of technical setup I look for — clear levels, logical structure, and a definable risk-reward scenario. Whether you’re positioning for a bounce or protecting against downside, the 6,770-6,780 zone is the line in the sand worth watching. In markets like this, structure beats noise every time, and sticking with the strategy is what pays.
I’ll see you in the markets.
Chris Pulver
Chris Pulver Trading
Follow along and join the conversation for real-time analysis, trade ideas, market insights and more!
- Telegram: https://t.me/+av20QmeKC5VjOTc5
- YouTube: https://www.youtube.com/@FinancialWars
- Twitter: https://x.com/realchrispulver
- Facebook: https://facebook.com/therealchrispulver
Important Note: No one from the ProsperityPub team or Chris Pulver Trading will ever contact you directly on Telegram.
*This is for informational and educational purposes only. There is inherent risk in trading, so trade at your own risk.
P.S. Don’t Take This Market Range for Granted
It’s not hard to see why…
All you have to do is leverage a special range in the market to target payouts in just hours…
With just $1,000 per trade!
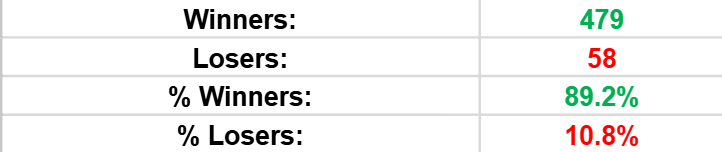
This straightforward approach has delivered an 89.2% win rate on over 400 live trades.
Want to see how to set up this trade?
We develop tools and strategies to the best of our ability, but no one can guarantee the future. There is always a risk of loss when trading. Past performance is not indicative of future results. Stated results are from live published alerts between 8/26/24 and 12/11/25. The win rate has been 89.2% on the options with an average return of 14.46% over a one-day hold time.