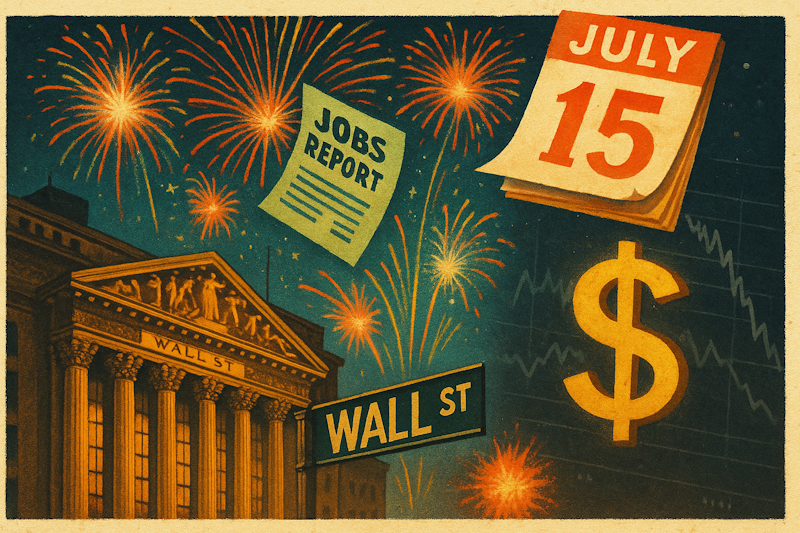
Election years always stir up market activity, and 2024 is shaping up to be no different.
Historically, the stock market tends to perform well during election years, driven by the potential for gridlock in Congress, which often favors a stable economic environment. If the House, Senate and the presidency remain divided, traders can expect the market to appreciate the lack of sweeping policy changes.
But let’s be real — this year’s election is anything but typical. We have a lot of variables at play here…
There’s the Biden-Harris administration, with Biden dropping out and Harris stepping into the spotlight. On the other side, Trump’s navigating legal battles and still making waves. So, there’s definitely more uncertainty in the political landscape than usual. And, in markets, uncertainty usually leads to volatility.
What’s fascinating, though, is that despite all this noise, historically, election years tend to end positively for stocks.
Why?
Because the market loves gridlock. If one party doesn’t sweep the House, Senate and White House, it makes it harder for sweeping policy changes to disrupt the status quo. Gridlock means less uncertainty about sudden regulatory changes or drastic shifts in economic policy.
That’s generally bullish for the market.
Now, look at what’s already happening. We’re headed into the November election with the S&P 500 sitting near all-time highs, and despite some volatility, it’s clear that traders expect the Fed to keep easing monetary policy.
Rate cuts are likely coming in November and December — another 50 basis points by the end of the year, bringing us down a full percentage point from the highs.
But here’s the catch…
Election years often see a sideways to slightly down market between October and November. With the Fed in play and earnings season ramping up, I wouldn’t be surprised to see some temporary pullbacks before we get that post-election rally.
So, what am I doing?
I’m hedging. There’s potential for both sides to see some action, but until we get clarity on the election results, I’m not betting on any massive breakouts just yet.
Stay cautious, watch those hedges, and be ready for some post-election market fireworks.
I’ll see you in the markets.
Chris Pulver
Chris Pulver Trading
Follow along and join the conversation for real-time analysis, trade ideas, market insights and more!
-
- Telegram: https://t.me/+av20QmeKC5VjOTc5
- YouTube: https://www.youtube.com/@ChrisPulverTrading
- Twitter: https://x.com/realchrispulver
- Facebook: https://facebook.com/therealchrispulver
*This is for informational and educational purposes only. There is inherent risk in trading, so trade at your own risk.
P.S. The Blue Line That Transformed My Trading
Ever noticed how exhausting it is to constantly chase the next big market move?
It’s like trying to catch lightning in a bottle… Exciting, sure. But rarely profitable in the long run.
Here’s something I’ve learned after years in the trenches…
The market’s biggest moves? They usually happen when we’re not looking.
Overnight, during lunch, or while we’re stuck in traffic.
Don’t believe me? See…
During regular trading hours, the S&P 500 has barely budged. For 24 years…

The blue line shows you the movement during the regular market hours from 9:30 a.m. to 4 p.m. ET.
Sounds crazy, right? But the data doesn’t lie.
What If We Stopped Trying So Hard?
The trades expressed are from historical back teste] data from June 2022 through April 2024 combined with Chris’s live money trading from June 2024 through September 1 2024 to dem@hstrate the potential of the system. The average winning trade during the backtested data was 11.5% while the average losing position was 74.5% per trade and a 90.9% win rate. The average winning trade during the real time data was 10.5% while the average losing position was 29.5% per trade and an 83% win rate.


