🚨 I’ll be live at 9 a.m. ET🚨
The S&P 500 and Nasdaq hit new all-time highs so lets discuss that, the markets showing worry being left behind even with midterms approaching and more, including a bonus trade for Double Ups [tap to join us for the Daily Profit Plan]!
The market is within striking distance of all-time highs, yet I’m holding more cash than usual. That might seem contradictory, but the two scenarios I’m watching for the rest of the year explain why.
I see potential for a blowoff top above 8,000, or a correction to 7,000 or lower. The tail risk cuts both ways, so I’m reluctant to chase the market from current levels.
The Blowoff Top Scenario: 8,000 Could Come Fast
If a blowoff top develops, I think the market could target 8,000-plus. It likely wouldn’t be a healthy, broad-based rally. The Magnificent Seven and semiconductors are doing much of the work to keep the indexes elevated, while other areas of the market remain less resilient.
That concentration could drive the index higher, but it also leaves the broader market vulnerable if leadership weakens.
Once we clear 7,817, the recent velocity could repeat itself. We’ve already seen moves of roughly 200 points in two days. Another burst like that could take the market near 7,900 before holiday trading carries it through 8,000.
However, 8,000 isn’t necessarily a level that stops the market. If we break through it inefficiently, the longer-term path could eventually point toward 10,000. Even if the market surges first, I believe it will eventually backfill and produce a more attractive buying opportunity.
I’m also expecting volatility. Historically, October and November have produced an average peak in the VIX near 21, and a median peak near 28. That doesn’t guarantee a correction, but it reinforces the case for staying flexible as the market approaches major resistance.
The Correction Scenario: Where I’d Get Aggressive
A pullback would interest me much more. I’m not excited about chasing roughly 3% of potential upside when a decline toward 7,500 could create a far more tradable setup with clearer risk and better reward. Holding cash allows me to respond if that opportunity appears rather than forcing exposure near the highs.
The key levels are the Federal Open Market Committee low near 7,507, previous structure around 7,300 and prior all-time highs near 7,000. Those are areas where I’d consider deploying cash aggressively.
I want to see a technical bounce where former resistance becomes support, or a meaningful correction that creates a rally from a known level. I’d also welcome a move below the 200-day moving average followed by a recovery above it.
Deeper levels include year-to-date breakeven near 6,800 and the year-to-date low around 6,300. The market could even fall toward 6,000 while remaining within its larger bull-market trend.
The market probably won’t remain between 7,600 and 7,800 for the rest of the year. If it rises immediately, I’ll have less cash deployed. If volatility produces a proper correction, I’ll be ready to buy. In today’s market, patience matters more than chasing a limited amount of upside.
I’ll see you in the markets.
Chris Pulver
Chris Pulver Trading
Follow along and join the conversation for real-time analysis, trade ideas, market insights and more!
- Telegram:https://t.me/+av20QmeKC5VjOTc5
- YouTube:https://www.youtube.com/@FinancialWars
- Twitter:https://x.com/realchrispulver
- Facebook: https://facebook.com/therealchrispulver
Important Note: No one from the ProsperityPub team or Chris Pulver Trading will ever contact you directly on Telegram.
*This is for informational and educational purposes only. There is inherent risk in trading, so trade at your own risk.
P.S. Catch This Breakout Opportunity Before It Erupts
Hiding in plain sight in a stock’s price action…
Lies a subtle hint that it’s likely ready for a super squeeze.
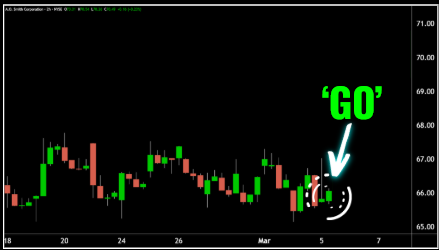
I’m talking about a moment in time where a ticker is forced to make a BIG move.
Opening the window to target explosive returns like…

All hitting your brokerage account within days — without staring at your computer screen the whole time.
There were smaller winners and those that didn’t work and I won’t make reckless guarantees about the stock market…
But right now…
One of the hottest tickers in the market is setting up for a super squeeze…
If history is any guide, we could see a parabolic move within days.
We develop tools and strategies to the best of our ability, but we can’t guarantee the future. Trading always carries a risk of loss. Past performance is not indicative of future results. While we have used the Pinch Point Scanner with great success, we cannot guarantee future results. Today, you will see some of the best examples from the last few months. There were bigger winners, smaller winners, and losers. Since the Pinch Point Scanner is a tool for traders and not a trading service, profits and performance will vary among users.