I was analyzing some divergence patterns the other day, and what I found reinforced something I’ve been discussing quite a bit lately.
When someone asks me if I see divergence in the current market, the answer is absolutely — and it’s showing up in multiple places that suggest we should be preparing for a pullback.
Here’s what I mean by divergence…
We’ve got higher highs in price while momentum indicators are disagreeing, along with relative strength showing disagreement. This isn’t just a minor technical hiccup — it’s a pattern that typically precedes market corrections.
And the next could be a big one.
Daily Chart Signals Point to Overbought Conditions
Looking at the daily time frame, we have higher highs in price but lower highs in momentum, with overbought conditions showing up in both 14- and 21-period relative strength indicators.
This creates what I call “hidden bearish divergence” — the kind of setup that suggests the market is running out of steam.
What makes this particularly noteworthy is that we’re seeing similar patterns across major indices, with prices trying to make higher highs while relative strength momentum is disagreeing.
This isn’t isolated to one sector or index — it’s broad-based.
Timing the Expected Correction Window
Now, divergence doesn’t mean we’re automatically at the top, but it does suggest we should expect a pullback.
I’m giving myself a window from now until probably the end of September, with the end of September to early October being when the market could incorporate some type of correction.
We’re talking about a potential 3% to 5% pullback, with 10% being a bit nasty but certainly possible. To put this in perspective, the NASDAQ is up almost 38.5% off the lows, so a small pullback of 3% to 5% is really nothing in the grand scheme of things.
The weekly time frame adds another layer to this analysis. The 14-period RSI is overbought while the 21 is close but not quite there yet. This suggests we’re approaching similar overbought levels we’ve seen at previous tops.
Given these conditions, I’m not buying these tops — instead, I’m positioning for income and hedges at much lower levels.
This market environment calls for patience and strategic positioning rather than chasing momentum.
I’ll see you in the markets.
Chris Pulver
Chris Pulver Trading
Follow along and join the conversation for real-time analysis, trade ideas, market insights and more!
- Telegram:https://t.me/+av20QmeKC5VjOTc5
- YouTube:https://www.youtube.com/@FinancialWars
- Twitter:https://x.com/realchrispulver
- Facebook: https://facebook.com/therealchrispulver
Important Note: No one from the ProsperityPub team or Chris Pulver Trading will ever contact you directly on Telegram.
*This is for informational and educational purposes only. There is inherent risk in trading, so trade at your own risk.
P.S. Forget Headlines and Earnings — ‘Liquidity Levels’ Could Be Your Biggest Edge
While everyone waits for the next big announcement, I’ve discovered how to spot “Liquidity Levels” where market makers are placing undercover buy orders worth hundreds of millions…
That could force stock rallies in 24 hours or less.
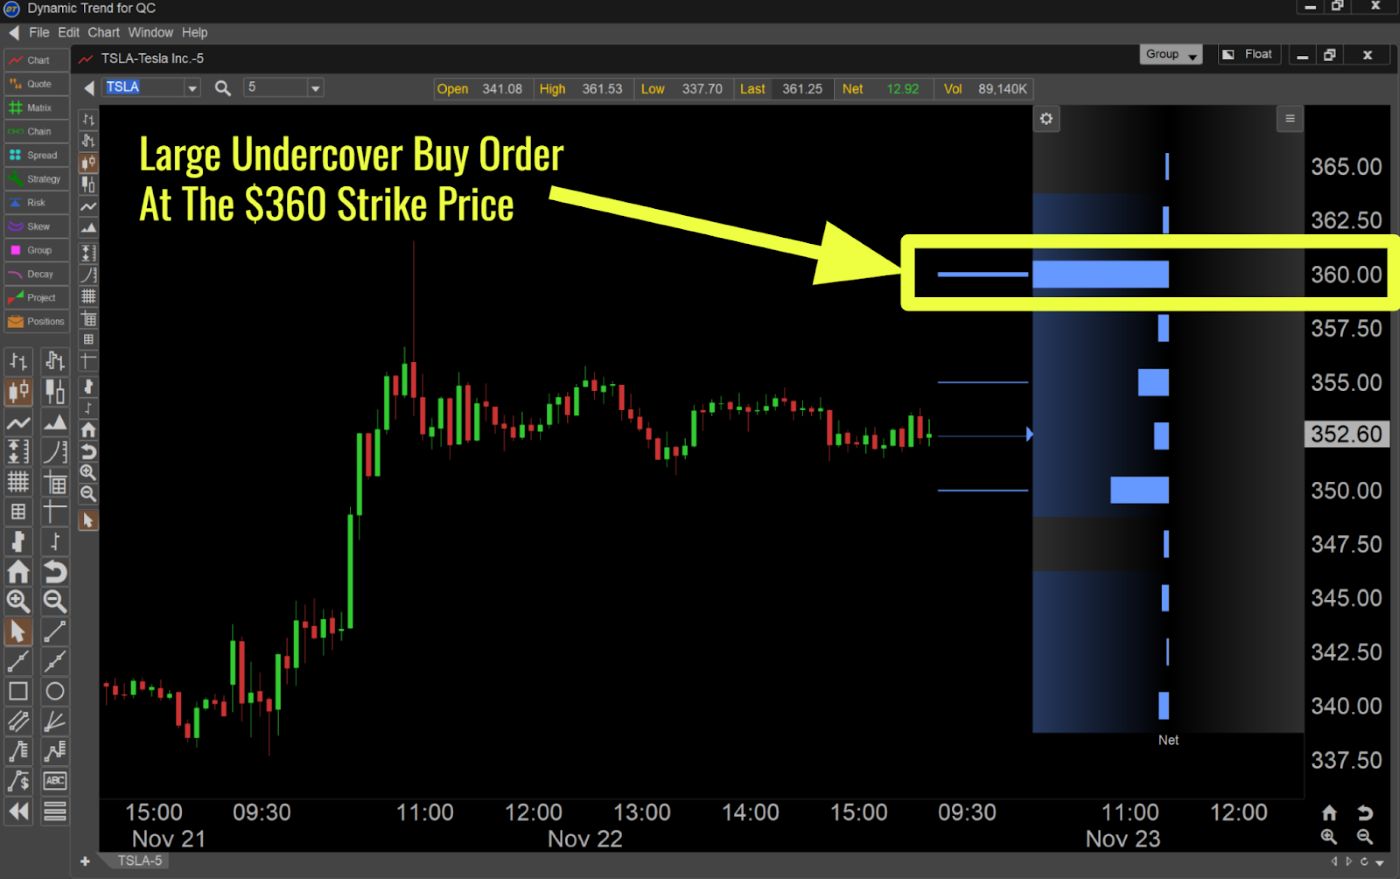
Warren Buffett called the market a casino, but what if you could see where the “house” is placing its bets worth hundreds of billions?