
🚨 I’ll be live at 11:30 a.m. ET🚨
We’ll manage and roll our income trades [tap to join us for Market Masters]!
Before we really dive in, you can watch the full presentation I did on this lesson and more! Now let’s get to it…
A stock makes a strong move higher, then starts falling. Is the rally over, or is this the pullback that sets up the next leg?
I use a pattern I call the measured bounce to answer that question. It starts with three turning points: the low where the move began, the high where the first leg ended and the low where the pullback ends. Once I have those points, I can measure the setup and plan a trade.
I don’t need to know the perfect Elliott wave count to use it.
First, Measure the Pullback
I measure the distance from the starting low to the first high, then watch how much of that move price gives back. My preferred pullback reaches about 61.8% of the first leg. I’ll also look at a range from 50% to 78.6%, but 61.8% is where I’ve found the clearest setups.
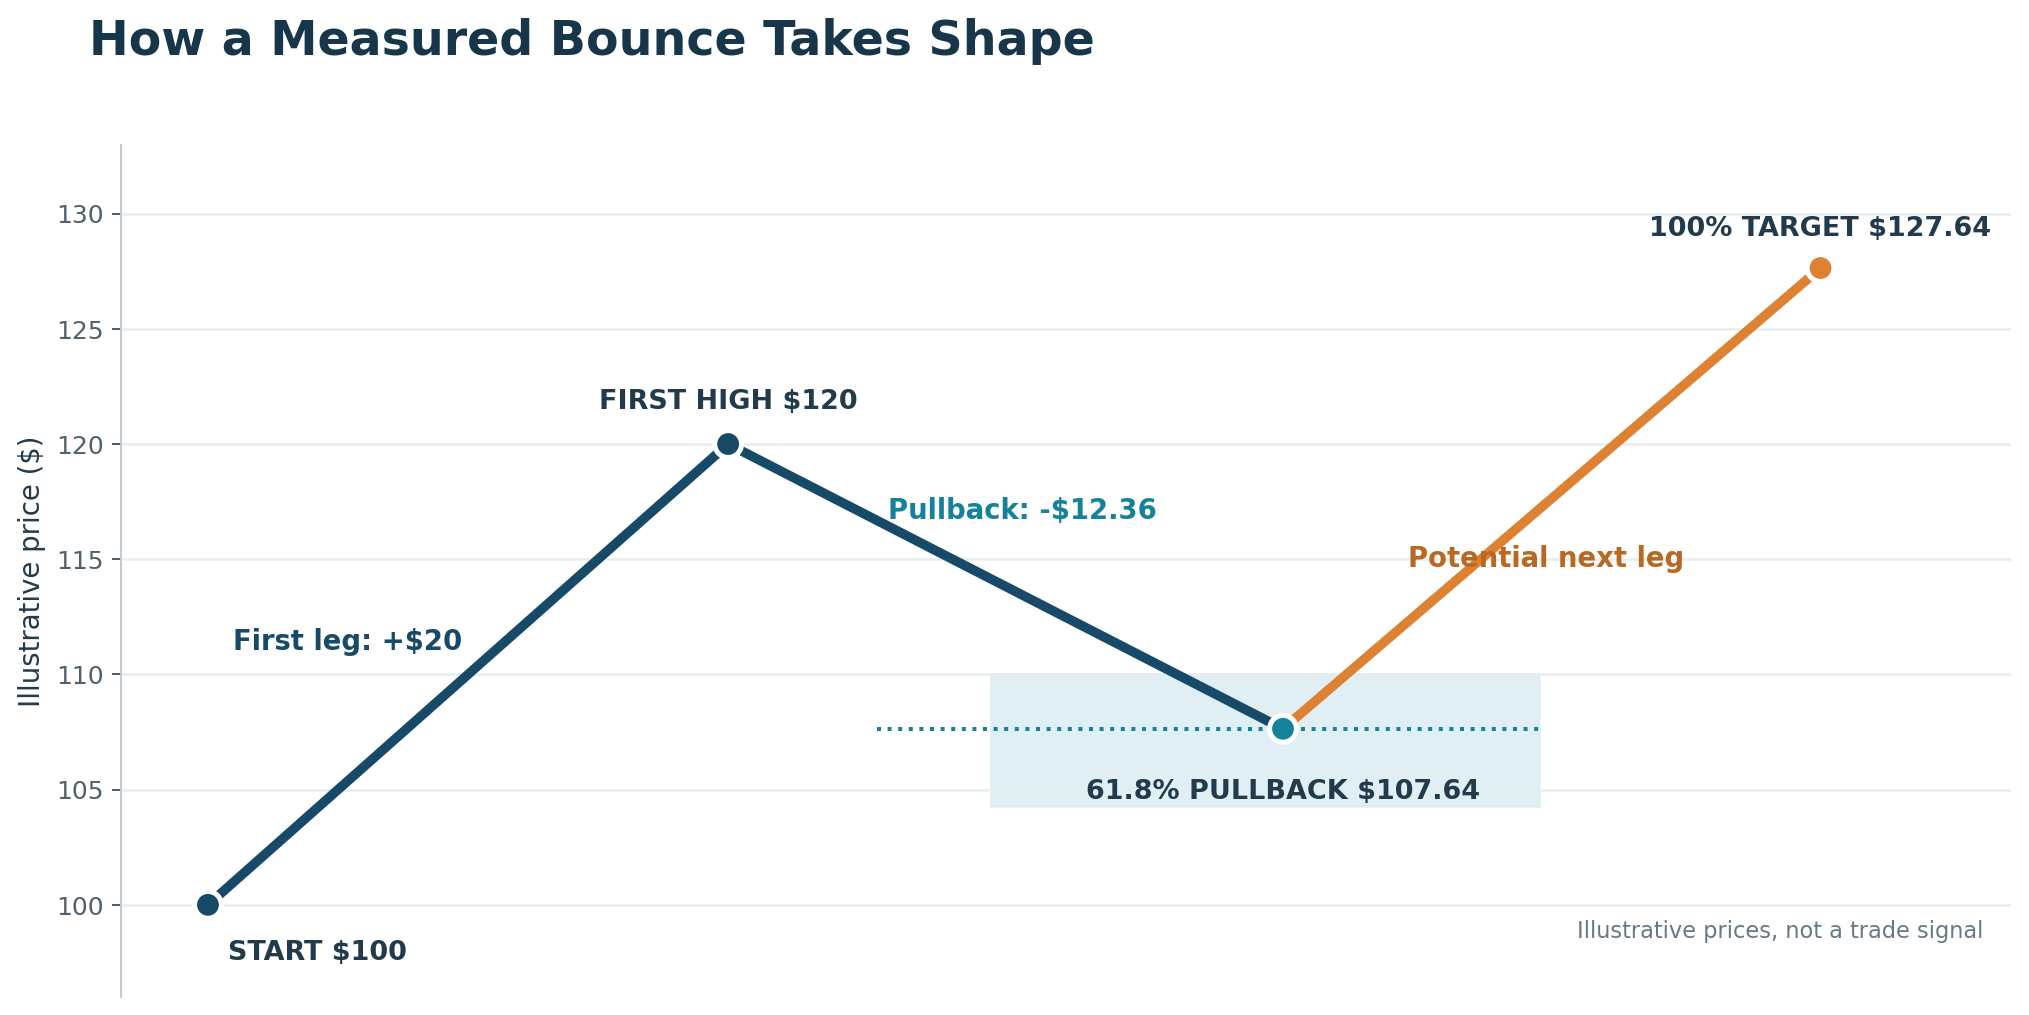
In the illustration, the first leg rises $20, from $100 to $120. A 61.8% pullback gives back $12.36, putting the pullback low at $107.64.
That level tells me where to pay attention. It does not tell me to buy. Price can touch 61.8% and keep falling. I want to see the pullback hold and price show evidence that the next move higher has begun before I enter.
Then, Map the Next Leg
The first leg also gives me a way to project potential targets. I measure its $20 length from the $107.64 pullback low, not from the original $100 low.
| Possible Outcome | Calculation | Illustrative Price |
| Next leg equals the first leg | $107.64 + $20 | $127.64 |
| Next leg reaches 127.2% of the first leg | $107.64 + $25.44 | $133.08 |
| Next leg reaches 161.8% of the first leg | $107.64 + $32.36 | $140 |
Why the different targets? The pattern could become an A-B-C correction, with the next leg acting as wave C. Or it could be the beginning of a larger five-wave move, with the next leg acting as wave three. Early on, the two can look remarkably similar.
I can trade the move they share without insisting I know which label is right. If price approaches the 100% to 127.2% zone, I can consider taking profits or tightening my stop. If it pushes through that area, the 161.8% level gives me another reference point. Those are planning levels, not promises about where price must stop.
Let Price Confirm the Setup
Before placing a trade, I decide what would make me enter, where I would take profits and what price action would prove my idea wrong. I also check the larger trend and the smaller moves inside the pattern. A shape that looks convincing on one chart can become much less clear when I examine it more closely.
That’s why I’m willing to pass on a messy setup. I don’t need to put money at risk every time a stock touches a Fibonacci line.
The measured bounce gives me a practical map: Find the first leg, measure the pullback, wait for confirmation and project the next move. I may not know whether the market is drawing a wave three or a wave C until later. I can still know what I’m looking for before I make the trade.
Jeffry Turnmire
Jeffry Turnmire Trading
I host my Morning Monster livestream at 9:15 a.m. ET each weekday on YouTube, and then 30 Minutes of Awesome at 5 p.m. ET each Tuesday!
Please check out my channel and hit that Subscribe button!
You can also follow along and join the conversation for real-time analysis, trade ideas, market insights and more!
- Telegram:https://t.me/+6TdDE7-F6GlhMmJh
Important Note: No one from the ProsperityPub team or Jeffry Turnmire Trading will ever message you directly on Telegram.
I’m just a regular dude in Knoxville, Tennessee: a husband, father, civil engineer, urban farmer, maker and trader.
I’ve been at this trading thing with real money for 20-plus years, and started paper trading over 35 years ago. I have a knack for making some epic predictions that just may very well come true. Why share them? Because I like helping other people — it’s the Eagle Scout in me.
*This is for informational and educational purposes only. There is inherent risk in trading, so trade at your own risk.
P.S. Go After Triple-Digit Gains Without Buying a Single Option
Backed by historical research showing gains like 91% in a week and 216% within a month…
Supercharged Tickers let regular traders target massive moves with far less hassle.
Get the full walkthrough on how these vehicles work and see how you can begin trading them by the next opening bell.
See How to Start Trading Supercharged Tickers