🚨 I’ll be live at 9 a.m. ET🚨
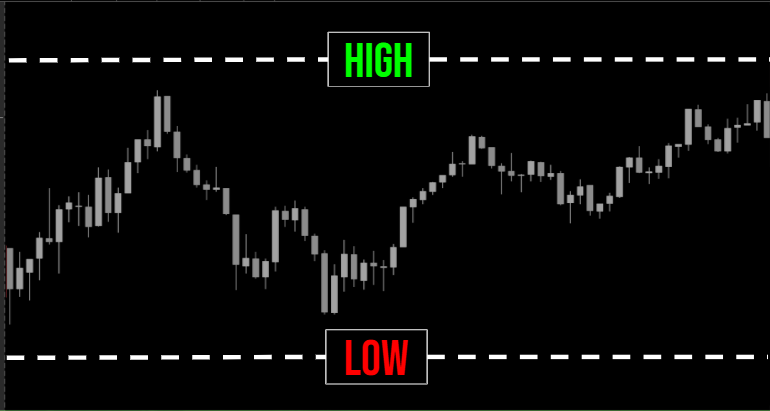
We’ll cover index options and earnings all moving today, a big nonfarm payrolls report and and the zone the S&P 500 is stuck in [tap to join us for the Daily Profit Plan]!
There’s a specific calculation I use every single day that most traders overlook — and it’s one of the main reasons I can consistently target 90%+ probability trades.
It’s not just about knowing the market maker’s expected move — that’s table stakes. What really matters is how you apply that move when the market gaps, and most traders only do half the equation.
Let me walk you through exactly how I set up my trading boundaries using what I call the double-gap safety buffer system on SPX.
Measuring Efficiency From Both the Close and the Gap
Here’s where most traders go wrong. They take the market maker move — let’s say it’s 47 points like it was on Monday — and they measure it from Friday’s close. That gave me an upper efficiency boundary at 6,978.
But I don’t stop there. We gapped lower on Monday, so I also took the gap open and measured 47 points down from there, which gave me a lower boundary at 6,864. That’s the key. Measuring from both the close and the gap creates the double-gap safety buffer that keeps me out of trouble.
This dual reference approach keeps me safe because I’m not assuming the market will behave off one starting point. I’m building in extra protection by calculating both sides of the move.
How This Translates Into Actual Trade Selection
Once I’ve got those boundaries set, I can position my trades with confidence. For my Daily Profit Play service, I target 10-delta strikes that stay outside these efficiency zones. On Monday, that meant going to 6,980 on the call side — just outside the 6,978 boundary — and 6,860 on the put side, below the 6,864 lower boundary.
I’m not trying to thread the needle. I just want to stay outside the ranges where market makers historically keep prices contained.
And here’s the thing — I constantly verify this throughout the day. I’m always asking myself: “Did the market maker do the job? Are we holding inside the boundaries I calculated early?”
Nine times out of 10, the answer is yes. That’s the edge. It’s not about predicting where price will go — it’s about identifying where it’s unlikely to go.
This method isn’t flashy, but it works. Measuring from both the close and the gap creates dual safety zones that align with expected move behavior. That’s how I maintain 90%+ win rates — not by swinging for home runs but by staying far outside the danger zones.
I’ll see you in the markets.
Chris Pulver
Chris Pulver Trading
Follow along and join the conversation for real-time analysis, trade ideas, market insights and more!
- Telegram:https://t.me/+av20QmeKC5VjOTc5
- YouTube:https://www.youtube.com/@FinancialWars
- Twitter:https://x.com/realchrispulver
- Facebook: https://facebook.com/therealchrispulver
Important Note: No one from the ProsperityPub team or Chris Pulver Trading will ever contact you directly on Telegram.
*This is for informational and educational purposes only. There is inherent risk in trading, so trade at your own risk.
P.S. 1 Daily Trade Delivered 362 winners in 2025…
JUST by aligning every single trade with the market’s expected range for the day!
And in the first 22 trades this year, this same approach has delivered 18 winners.
Want to see how to get in on the next opportunity?
We develop tools and strategies to the best of our ability, but no one can guarantee the future. There is always a risk of loss when trading. Past performance is not indicative of future results. Stated results are from live published alerts between 8/26/24 and 1/22/25. The win rate has been 89.3% on the options with an average return of 14.62% over a one-day hold time.