I was reviewing some market charts yesterday, and something caught my eye that I just can’t shake.
We’re up about 30% on the S&P 500 since the April lows, and while that’s fantastic for anyone who’s been riding this wave, it’s also starting to look eerily familiar.
Here’s the thing — I’ve seen this movie before.
When I look back at the COVID crash recovery, we had a similar pattern. The market found its bottom, clawed back to all-time highs, then had a couple of corrections — around 10% and 9% — before the real fireworks began.
That market eventually ripped up 117% as monetary policy and fiscal spending created the perfect storm.
The Melt-Up Scenario Nobody Wants to Talk About
Look, I’m not here to call a top — that’s a fool’s game. There’s plenty of ridiculous amounts of upside before this top is in. But here’s what keeps me up at night: a melt-up to this degree is going to be met with another nasty correction, and that could be another 20%, 30%, 40% correction.
I’m talking about a real bubble scenario here. A market melt-up into the 6,500 or 7,000s range on the S&P 500 (SPY) would be a freaking bubble waiting to happen. And when bubbles pop, they don’t just deflate slowly — they explode.
I don’t think it’s out of the cards to have a 30% to 50% correction at some point in the next five years. The real question is…
Are you protected enough for that? Are you prepared for something that severe?
The Three-Legged Stool That’s Holding Everything Up
The resiliency of the U.S. market right now is because housing is still stable and not broken, employment is still stable and not broken, and the consumer is still spending.
These three pillars are propping up the markets and keeping everything running on AI hype, profit margin optimism and general “everything’s good” sentiment.
But if we break something — and the fastest way to do that is mess with the Fed — this whole structure could come tumbling down.
In the near term, if we break through all-time highs, don’t be surprised if we get an 8% to 10% correction afterward. I think we could see a pullback toward the 50-day moving average, with 6,000 as a nice round number target. If we fall below that level, it might signal the beginning of a more significant decline.
The bottom line? Enjoy the ride up, but don’t get complacent. This market has the potential to deliver spectacular gains — and equally spectacular losses.
I’ll see you in the markets.
Chris Pulver
Chris Pulver Trading
Follow along and join the conversation for real-time analysis, trade ideas, market insights and more!
- Telegram:https://t.me/+av20QmeKC5VjOTc5
- YouTube:https://www.youtube.com/@FinancialWars
- Twitter:https://x.com/realchrispulver
- Facebook: https://facebook.com/therealchrispulver
Important Note: No one from the ProsperityPub team or Chris Pulver Trading will ever contact you directly on Telegram.
*This is for informational and educational purposes only. There is inherent risk in trading, so trade at your own risk.
P.S. Forget Headlines and Earnings — ‘Liquidity Levels’ Could Be Your Biggest Edge
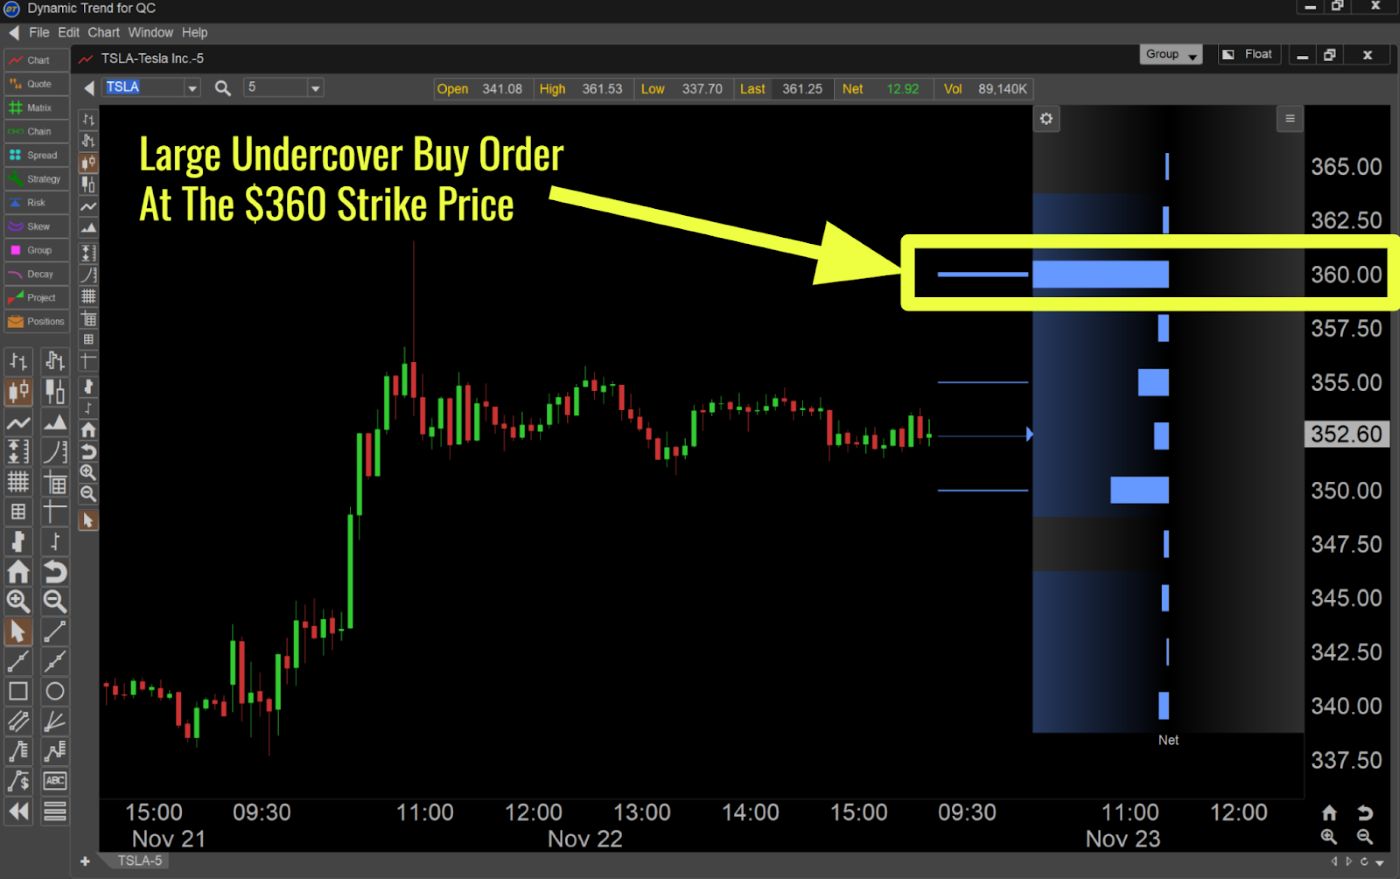
While everyone waits for the next big announcement, I’ve discovered how to spot “Liquidity Levels” where market makers are placing undercover buy orders worth hundreds of millions…
That could force stock rallies in 24 hours or less.

Warren Buffett called the market a casino, but what if you could see where the “house” is placing its bets worth hundreds of billions?


