>>>I’ll be live with Jack Carter at 11:30 AM ET for Market Masters — we’ll cover current trends and trades, actionable opportunities, trading education and more!<<<
There’s a trade setup I recently discovered that made me stop and pull up my calculator right in the middle of analyzing charts.
We’re talking about 18% monthly returns on a stock that’s also showing one of the cleanest bullish chart patterns I’ve seen in weeks. That’s the kind of opportunity that doesn’t come around every day — and when it does, you’d better understand exactly what you’re looking at.
The stock is Hims & Hers Health (HIMS), and the premium being offered on certain put options is nothing short of extraordinary. But here’s what makes this interesting beyond just the numbers — the chart is actually backing up the trade with a legitimate technical pattern.
The Premium That Made Me Do the Math Twice
Let me walk you through the specific setup I’m working with here.
I sold puts at the $16 strike and collected 60 cents in premium for about a week’s time. Now, when you’re dealing with options, these numbers might not sound dramatic at first — but let’s do the actual math on what this represents.
On a position of 10 contracts, that’s $3,000 collected against $16,000 of potential risk for roughly a month. When I calculated it out — and yes, I did this live because the numbers seemed almost too good — that works out to 18% return in a month, which annualizes to 225%.
That’s what I call “wow premium.”
Look, I know what you’re thinking — if the premium is that rich, there must be significant risk. And you’re absolutely right. HIMS carries real risk, no question about it. But this is where the technical analysis becomes critical to the entire thesis.
The Chart Pattern That Changes Everything
What separates this from just a premium grab is the underlying chart structure. HIMS is showing a classic bullish windup pattern — move up, retrace, move up, retrace, move up. This isn’t random consolidation — it’s a structured pattern that suggests energy building for the next leg higher.
If we get a breakout from this pattern, the upside potential is substantial. I’m looking at targets that could take this stock materially higher from current levels. We’re talking about potential upside of 56% to potentially 100% depending on how the breakout develops.
And here’s the beautiful part about the risk management on this trade — even if I do get assigned these puts, the premium available on the call side is equally impressive, allowing me to continue collecting income against the position.
This is what sophisticated options trading looks like — combining premium collection with solid technical analysis to create asymmetric risk-reward setups. You’re not just betting on direction or just collecting premium. You’re doing both, with a clear chart pattern supporting your thesis.
The numbers are compelling. The pattern is clear. The strategy is defined. Not every trade needs to be complicated — sometimes the best setups are the ones where everything aligns in your favor, and you just need to have the conviction to execute.
Jeffry Turnmire
Jeffry Turnmire Trading
I host my “Morning Monster” livestream at 9:15 a.m. ET each weekday on YouTube, and then “30 Minutes of Awesome” at 5 p.m. ET each Tuesday!
Please check out my channel and hit that Subscribe button!
You can also follow along and join the conversation for real-time analysis, trade ideas, market insights and more!
- Telegram:https://t.me/+6TdDE7-F6GlhMmJh
Important Note: No one from the ProsperityPub team or Jeffry Turnmire Trading will ever message you directly on Telegram.
I’m just a regular dude in Knoxville, Tennessee: a husband, father, civil engineer, urban farmer, maker and trader.
I’ve been at this trading thing with real money for 20-plus years, and started paper trading over 35 years ago. I have a knack for making some epic predictions that just may very well come true. Why share them? Because I like helping other people — it’s the Eagle Scout in me.
*This is for informational and educational purposes only. There is inherent risk in trading, so trade at your own risk.
P.S. Target High-Frequency Income Like Clockwork
Join Jack and I at 10:30 a.m. ET today as we give you the full brief on CashBot…
A fully automated high-frequency income approach research shows would have nailed an 89.7% win rate on over 200 trades.
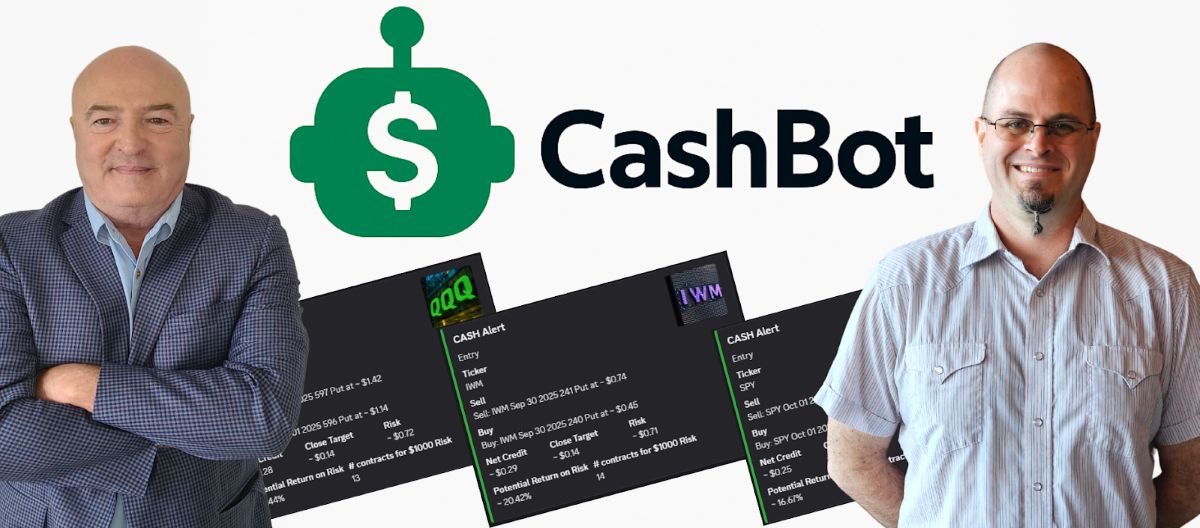
Today, you’ll also get the tickers CashBot is LIVE trading right now…