The Fed finds itself engaged in a currency war.
And in war you use whatever moral, empirical or intellectual cover you can find to justify more war. Currently, the Fed controls the battlefield, and it will use whatever cover it can to gain ground.
Right now, that cover is inflation and jobs. But the Fed has plenty of rabbits to pull from the “reasons to keep hiking” hat, should those two excuses fade alongside growth.
But Pivoters gonna Pivot. Once the market settles momentarily lower (unless something breaks and the only moment will be a Minsky one) they’ll go back to goal-seeking scenarios for their rising market hopes.
Unfortunately for them, the Fed confirmed yesterday that hope is not a strategy.
In his public comments immediately following the meeting, Fed Chair Powell went Big Country on the Pivoters:
- “The question of when to moderate the pace of increases is now much less important than the question of how high to raise rates and how long to keep monetary policy restrictive.”
- “…pausing is not something we’re thinking about…”
To which the market responded with “the worst 90 minutes of a Fed day in history.”
That bloody battle was due in part to the headwind that higher interest rates place on the present value of future earnings.
Which brings us to more of what’s possible when it comes to plumbing for a stock market bottom…
How Deep is the Deep End?
For a quick refresher, I claim that the S&P 500 could easily take out the 2018 highs of 2,947 but will more than likely revisit 2015 highs of 2,134 (a 43% drop from yesterday’s closing stock market rout).
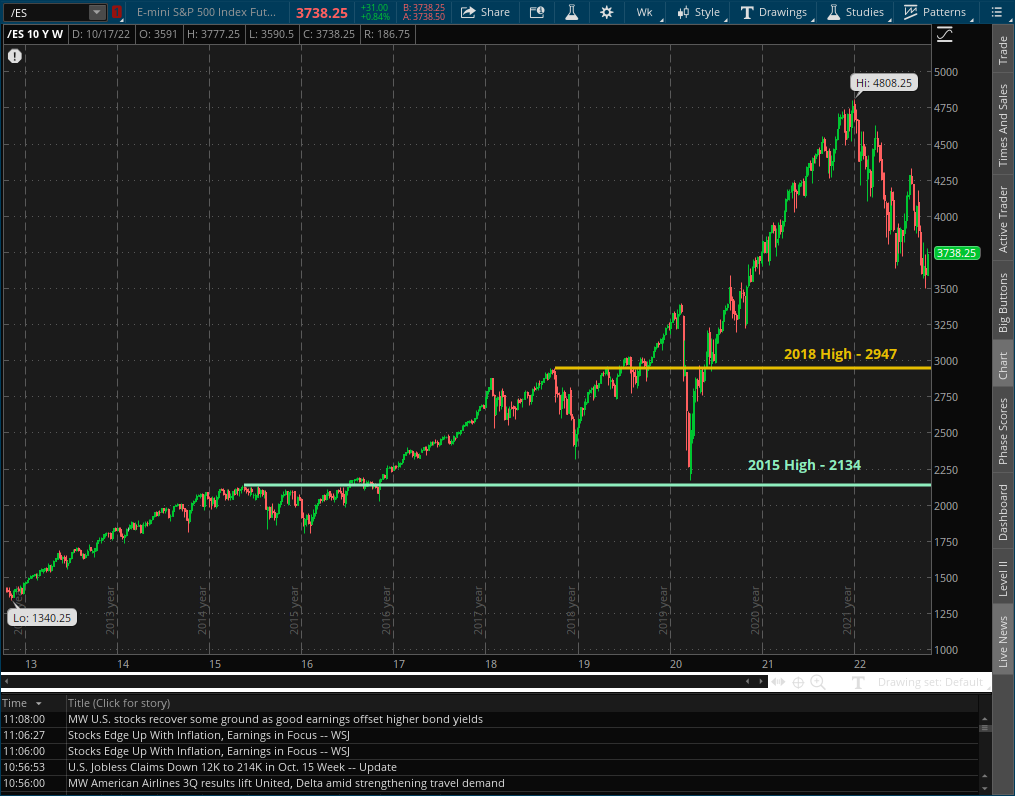
And I showed you a couple of weeks ago how Shiller’s P/E model and economic profits provide both precedent and mechanism for taking out the 2015 high or even lower.
And today I want to fathom those depths with a more refined instrument — empirical equity duration.
Dusting Off Some Old Research
Wait…don’t run. I know that sounds like financial gobbledygook, but it matters.
As I said before breaking down headwind #1, “I realize there’s no better way to get you stop reading than by working through interminable finance math… I’ll just step lightly through my reasoning… trusting that you trust me to get the theory and math right.”
So, here’s the theory.
Duration is to bonds as beta is to stocks. And, because stocks represent future cash flows much like bonds, stocks have duration too.
Beta tells you how much a stock’s price could fall based on, say, a 1% fall in the S&P 500. Duration tells you how much a bond’s price will fall based on 1% rise in 10-year treasury yields. Empirical equity duration predicts how much the S&P 500 price could fall for every 1% rise in 10-year treasury yields. And we figured this out based on how stocks and yields moved together in the past.
From what I learned when I first worked on this nearly 20 years ago, the bottom for the S&P is still a long way off.
And here’s the math on how to get there.
Enduring Duration
Duration is expressed in a number called “years” because of the tight relationship between a bond’s maturity and its price sensitivity.
The more “years” until a bond matures and, all else equal, the more sensitive its price is to changing interest rates.
When rates rise, bond prices fall. And bond duration tells you the percent those prices will fall for every percent rise interest rates.
For example, a bond with a 10-year duration will fall 10% for every 1% increase in 10-year treasury rates while a bond with a 20-year duration will fall 20%.
So far, so good. And you can also plot a similar relationship to stock prices.
Now, I left that study behind. And the original study I based it on was published in the early 80s. But the conclusion of both were that stocks typically exhibit a 15-year duration.
Google it and you’ll see similar results.
That means that when 10-year interest rates rise 1%, you can expect stock prices to fall by 15%.
So, to gauge how far stocks can fall, we must first start by seeing how far rates have risen.
Not Priced In Yet
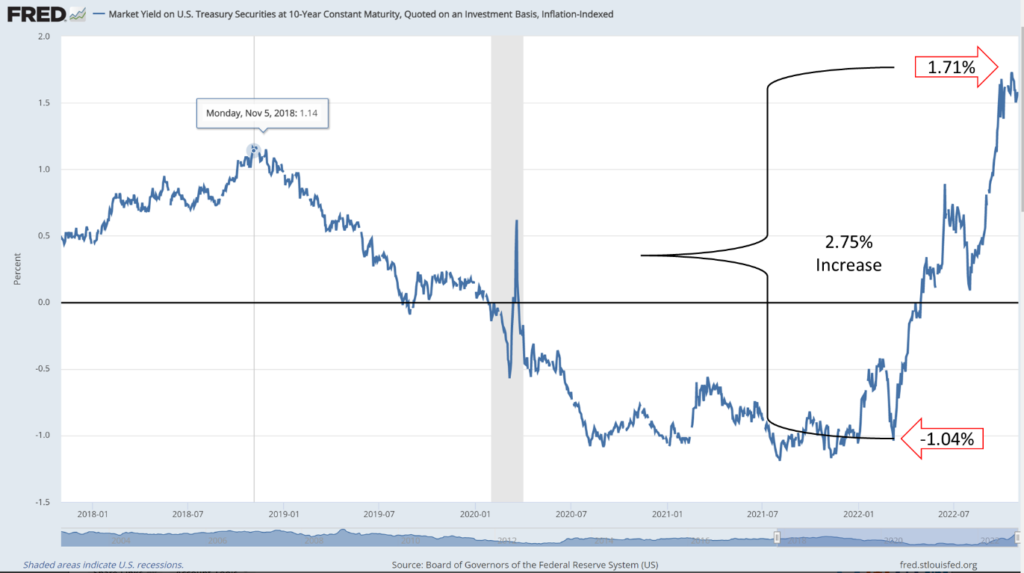
The chart above shows you how high the yield on 10-year inflation protected bonds have risen since just before the Fed began hiking through yesterday’s close (the chart doesn’t capture yesterday’s increase).
These are real yields which means they cancel out the confusing effects of inflation (which I’ll talk about in my next piece). And the 2.75% rise so far implies a 41% drop in stock prices.
Applying that 41% drop to last December’s peak of 4,808 on the S&P 500 implies 2,800 on the S&P — or another 25% from yesterday’s close.
That takes care of the 2018 highs.
But, like I said, the Fed is at war — so let’s assume bonds don’t yet price in the full extent of the Fed’s aggression. The 2015 highs are basically another 25% lower still. And based on that 15-year duration number I’m working with here, about 1% higher on the 10-year real yield, or two to three rate hikes (pivot or no) should do it.
War is hell, indeed.
Unless you know how to get on the winning side, that is.
Hope may not be a strategy, but paying attention, accepting facts, and taking action is.
To act in line with the ongoing — and deepening — bear market, join my Daily Pick.
For just $9 per month, you’ll get a pick per day — plus the big picture perspective you need to make this market work for you.
And if you REALLY want to kick it into high gear, take a look at my coaching program. That’s where things get interesting.
In fact, my publisher wrote about his experience getting started trading with me.
Check it out and consider submitting an application. I’d love to trade this market with you.
I hope I’ll see you there.
And, as always…
Take What the Markets Give You
P.S. Come join my free Prosperity Pub Telegram channel. But beware: as one of my members, Raymond, said the other day: “Get into Don’s free Telegram channel and you’ll become a paying member soon enough!”