JOIN ME LIVE AT 9 AM ET FOR: TECHNICAL TUESDAYS
This is all about chart work. I’ll break down price levels, key patterns and potential trade setups. It’s where I’ll show how I’m drawing levels and setting entries and exits based on what the market gives us.
I’ve been watching something unfold in the precious metals space that’s honestly pretty rare — and it deserves your attention. Silver just broke convincingly above its 1980 and 2011 highs, putting it in territory we haven’t seen in over 40 years.
And here’s what makes this setup so compelling — we don’t really have a cap on silver right now.
When an asset clears multi-decade resistance like this, it enters what traders call blue sky breakout territory. There’s no overhead supply, no crowd of sellers leaning on price and no technical ceiling left.
Moves like this tend to reshape sentiment fast, pulling new traders in and forcing skeptics to recalibrate. That shift alone can increase volatility and volume as the market realizes it’s dealing with a very different environment than the one it’s been stuck in for decades.
Why $100 Isn’t Out of the Question
Let me walk you through the math here. I don’t think it’s out of the realm to think that silver could be $100 an ounce. That’s not hype — it’s a measured move based on the previous range.
Is it gonna happen all at once? No. It’s gonna happen in waves. There will be pullbacks and volatility but the structure is there.
We’re getting stretched away from the moving averages and that’s important. When price moves far above those levels, it tells you momentum is strong but it also hints at shakeouts along the way. That’s why this remains a buy-the-dip market for me — not because dips won’t happen but because the broader trend is firmly in control and the technicals reward entries on retracements, not chasing at extremes.
The iShares Silver Trust (SLV) ETF is marching up to fresh highs and anything that’s been long puts or ratio spreads all looks convincing. That’s the kind of confirmation you want to see in a trending market that’s finally freed from decades of congestion.
The One Thing I’m Monitoring Closely
There’s a natural balancing act within precious metals, and the gold/silver ratio is one of the best ways to see it. Historically, that ratio doesn’t let one metal run too far ahead of the other for too long.
When silver gets too aggressive, the ratio tends to pull back toward equilibrium — either from silver cooling off or gold playing catch-up. If we push down into the high 60s or mid-60s on that ratio, that’s where I’d expect a pause or a rotation.
None of that changes the long-term setup. It just means the market has rhythms, and understanding those rhythms helps you avoid getting shaken out during natural consolidation phases.
The bottom line is this: When you break 40-year highs with conviction and remove the technical ceiling, you’ve created a setup that deserves serious attention. The path to $100 isn’t going to be a straight line, but the technical foundation and the sentiment shift that comes from a breakout of this magnitude are now firmly in place.
I’ll see you in the markets.
Chris Pulver
Chris Pulver Trading
Follow along and join the conversation for real-time analysis, trade ideas, market insights and more!
- Telegram:https://t.me/+av20QmeKC5VjOTc5
- YouTube:https://www.youtube.com/@FinancialWars
- Twitter:https://x.com/realchrispulver
- Facebook: https://facebook.com/therealchrispulver
Important Note: No one from the ProsperityPub team or Chris Pulver Trading will ever contact you directly on Telegram.
*This is for informational and educational purposes only. There is inherent risk in trading, so trade at your own risk.
P.S. (INSIDE) NEW Predictive Stock Market Breakthrough!
Discover a brand-new way to target parabolic breakouts…
On the world’s most “boring” stocks!
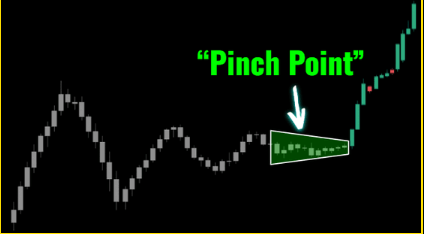
PLUS, Instantly unlock the No. 1 stock that’s in a rare “pinch” setup right now… 100% free!